The JPEG Quality Slider Is Not a Percentage! What Exactly Is the Difference Between 80 and 100?
When you export an image, do you always treat the JPEG quality slider as a percentage? Drag it to 80 and you think, “I’ve preserved 80% of the image quality.” Pull it to 100 and you think, “Now not a single bit is lost.”
This understanding needs to be completely overturned: the number on the slider has nothing to do with “what percentage of image quality” is retained, and quality 100 is not lossless either. Here is the practical conclusion first: if you want to archive photos with confidence, use 85–92; for websites and social media, 75–82 is enough; don’t set 100 as the default, because it will only double or even triple the file size without improving image quality at all. Now let’s break this slider down in plain language.
Simply put: the JPEG quality slider does not control “how much image quality is retained”; it controls how aggressive the divisors in the quantization table are. The larger the divisor, the more aggressive the rounding and the more data is lost. It is not linearly related to image quality or file size, and a change from 100 to 90 is not equivalent to a change from 20 to 10.
What Does the JPEG Quality Slider Actually Do?
First, let’s establish a premise: JPEG is a lossy format, and data loss begins the moment you press Save. The slider only determines how aggressively data is lost, not whether it is lost. Its compression process follows a fixed pipeline, and the slider is the final gate in that pipeline.
When saving, the image is first converted from RGB to YCbCr, separating brightness and color into two channels. This separation is done because the human eye is much better at perceiving brightness than color. By separating them first, we can focus on preserving brightness later.
Next, the entire image is divided into 8×8-pixel blocks, and each block undergoes a Discrete Cosine Transform (DCT) to convert pixel colors into a series of frequency values. You can think of this as breaking a chord down into individual notes: low frequencies represent the image’s base colors and gradients, while high frequencies represent sharp edges and fine textures. The full process is described in detail in the JPEG entry on Wikipedia.
The real killer move comes in the final step: each frequency value is divided by a number from the quantization table and then rounded to the nearest integer. This rounding is where information permanently dies—any fractional remainder is simply thrown away and cannot be recovered. What the quality slider controls is how aggressive these divisors are: a high slider value means small divisors, so rounding barely affects the data; a low slider value means large divisors, so rounding directly smooths out detail. And because the divisors for high-frequency components increase faster, it is the edges and fine textures that are sacrificed first.
That is why it cannot be treated as a percentage. The change in the divisors when the slider goes from 100 to 90 is completely different from when it goes from 20 to 10, and the resulting differences in image quality and file size are also completely different. Moving the slider one notch near 90 may be imperceptible; moving it one notch near 20 can ruin the image. Treating it as a percentage is the most common and most costly misunderstanding about this control.
Why Isn’t Quality 100 Lossless?
Answer: 100 still falls short of lossless because of two hard limitations. One is independent of the slider, and the other cannot be fixed even by the slider.
The first is chroma subsampling. After RGB is converted to YCbCr and before actual compression begins, most encoders discard about 75% of the chroma detail. The reason is the same: the human eye is insensitive to color, so the loss is not noticeable. This step is not controlled by the slider at all; even if you set it to 100, it still happens.
The second is that the math itself is not exact. Even if the divisors in the quantization table are minimized, the back-and-forth process of “pixel-to-frequency conversion and frequency-to-pixel conversion” still introduces small rounding errors. When the saved file is decoded, it is no longer the same set of pixels as when you pressed Save.
If you truly want to preserve every bit, choose a lossless format: PNG, TIFF, or lossless WebP. Lossy formats are one-way streets, and this applies to every JPEG quality level, including the seemingly “perfect” 100.
How to Choose Between 85–92 and 75–82
After extensive real-world testing and pixel-level comparison, we arrived at a clear dividing line: two ranges that cover almost every scenario.
85–92 is the archival range. Use it for portfolios, images delivered to clients, and original files you do not want to touch. Files saved at quality 90 are about 1/8 to 1/12 the size of uncompressed files, and the difference is invisible to the naked eye—you have to zoom in to 400% and stare at a small patch to pick out changes.
75–82 is the web range. Use it for website images and social media uploads. File size is 40%–60% smaller than in the archival range, mainly at the cost of slightly softening complex textures, which are barely noticeable under normal viewing.
If you have read the previous article “Lossy and Lossless,” the 80–85 sweet spot given there does not conflict with these two ranges: 80 is already within the web range, and 85 falls right into the archival range. Images already saved in the 80–85 range do not need to be reprocessed.
To summarize the three ranges in one sentence: keep what you want to keep at 85–92, send out what you want to send out at 75–82, and avoid the minefield below 60.
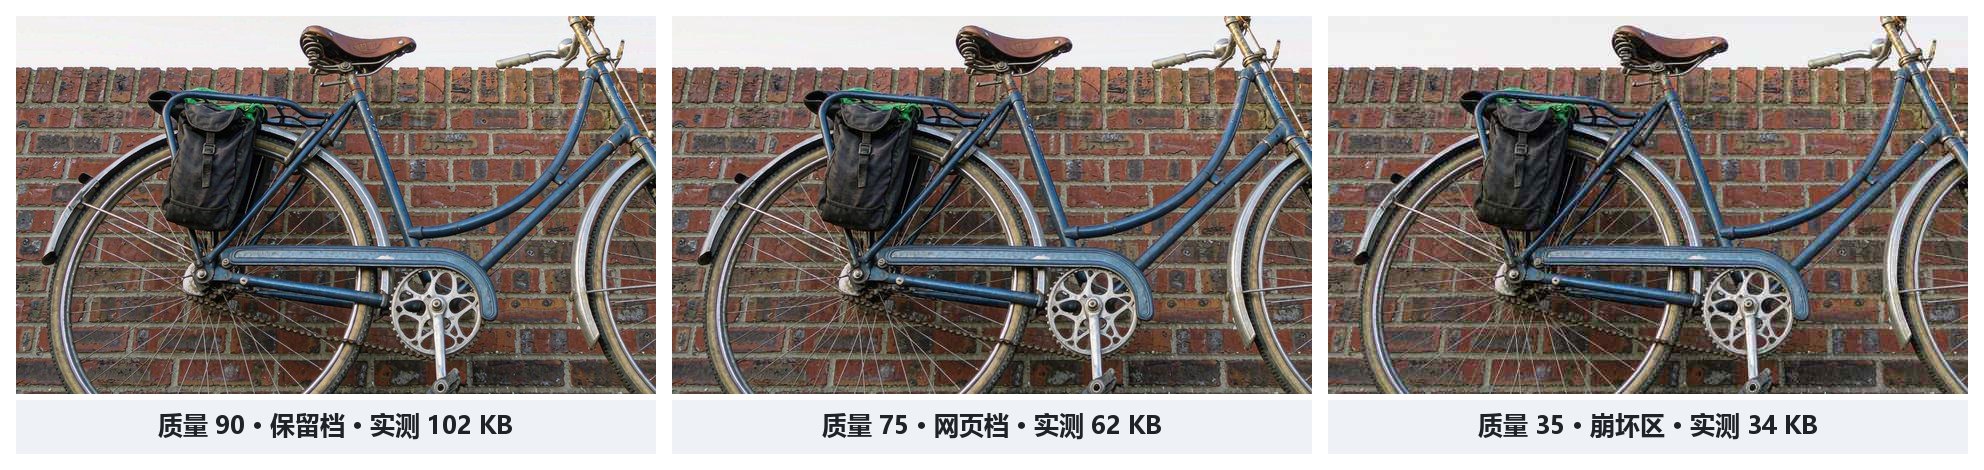
Setting export quality to 100 by default is a sign of anxiety, not a strategy. A file with quality 85 is 60%–75% smaller than one with quality 100, yet there is no discernible difference in image quality. For web pages, this simply increases loading time — I have broken down the cost of website images in detail in the article on speeding up web page images.
Why Does Image Quality Collapse Below 60?
When the slider goes below 60, image quality does not decline gradually; it falls off a cliff.
The reason is still rounding. When the value is too low, the divisors for high-frequency components become ridiculously large. After division and rounding, the frequency value is rounded directly to zero — that detail is effectively not stored at all. As a result, entire categories of visual information disappear en masse: hair strands, fabric weave, and the tips of strokes in serif fonts are among the first to go.
The remaining image shows standard JPEG artifacts: 8×8 blocks, banding in gradients, jagged edges around sharp edges, and mosquito noise. The large shapes remain, but the image is no longer “a picture meant for viewing.” I have written a separate illustrated article on how each type of artifact appears.
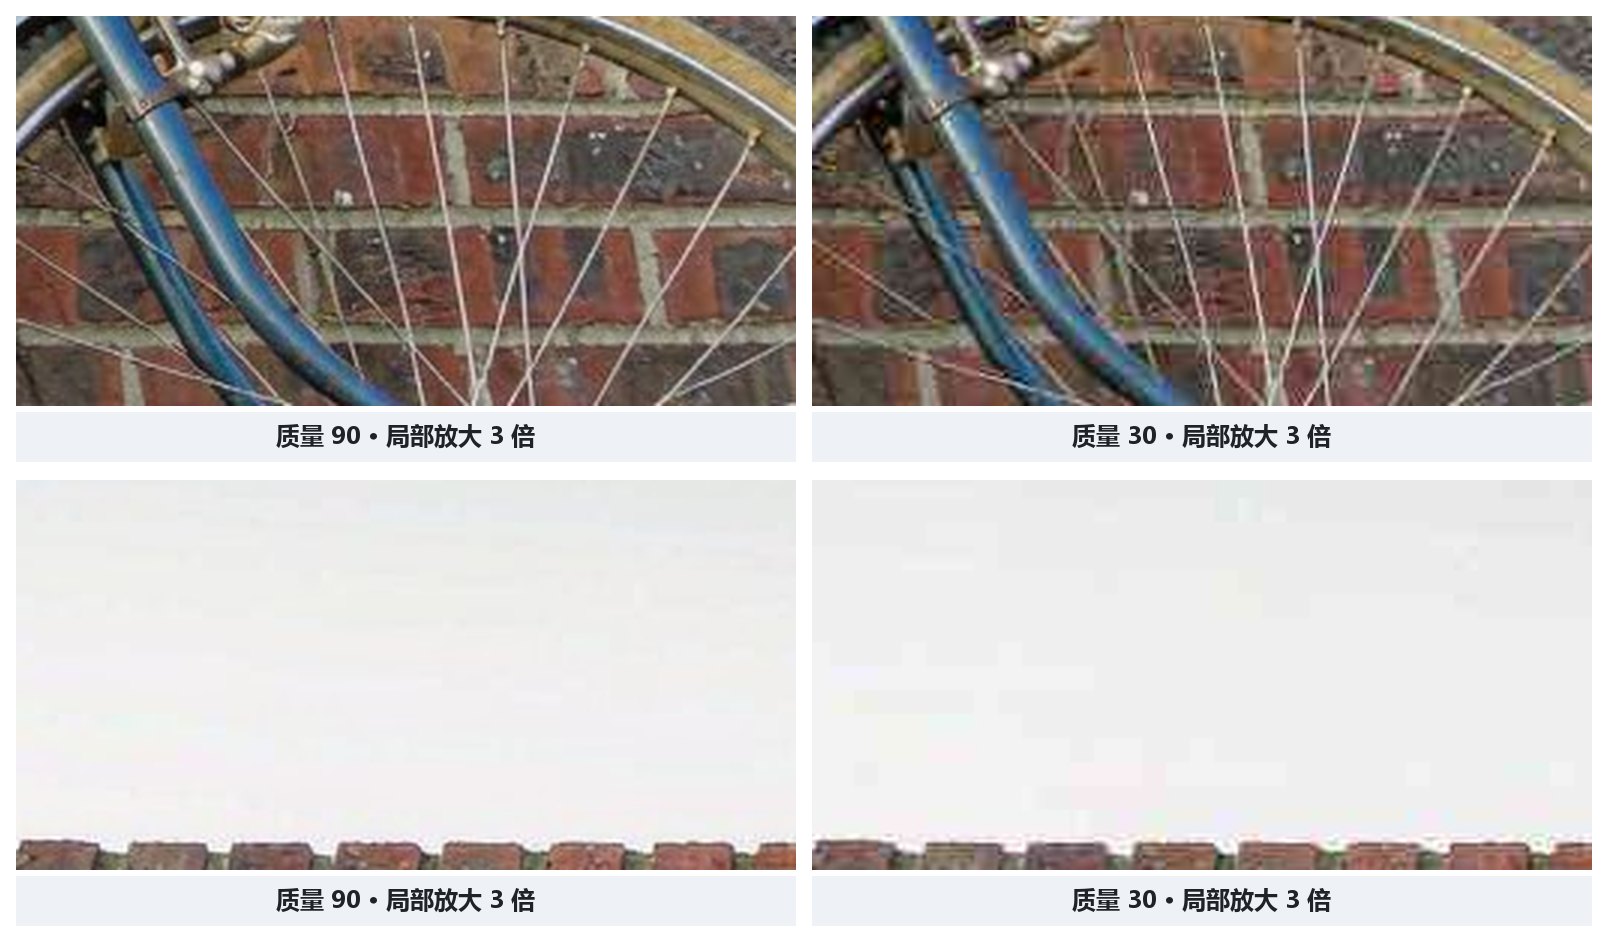
So my conclusion is: 60 is the practical lower limit for ordinary images. Saving a few KB by going below that only produces something that looks fake at a glance, which is not worth it.
At the Same Quality of 90, Different Software Exports Different Results
“Quality 90” is not a universal currency. The JPEG specification provides a set of recommended quantization tables (Annex K), but each software maker decides which table to use and how to scale it. Even for “high quality,” four common tools use completely different numbers: Photoshop has a scale of 0–12, where 10 is roughly equivalent to 90 in the reference implementation libjpeg; GIMP and ImageMagick both use a 1–100 scale, with GIMP’s “high quality” setting at 85 and ImageMagick’s at 92; libjpeg, as the reference implementation, sets its own reference value at 90.
Even if two tools are both set to “quality 85,” the exported files will not be identical. So don’t memorize a number in one piece of software and copy it to another. When comparing across software and projects, there are only two reliable methods: look at the actual output file size and the actual visual result.
A More Reliable Yardstick Than the Naked Eye: SSIM
The slider is unreliable, and the naked eye is affected by the screen and viewing conditions. Can the question of “not being able to see the difference” be quantified? Yes — a much more reliable approach is to use a different yardstick: the Structural Similarity Index Measure (SSIM).
It does not compare pixels one by one; instead, it looks at how much structure, brightness, and contrast have changed. This is closer to how the human eye judges images than “counting how many pixels are different.” The score ranges from 0 to 1, with 1 meaning the two images are completely identical. The formula and details are clearly explained in the SSIM entry on Wikipedia.
For common quality settings, SSIM scores are roughly as follows: files with quality 85 generally score above 0.97, making them visually indistinguishable from the original; at 60, the score falls between 0.90 and 0.93, with slight softness visible only when zoomed in; at 40, the score drops to only 0.82–0.87, with artifacts visible to the naked eye.
These numbers are much more honest than the slider. To determine quality without relying on guesswork, you can use the compare command in ImageMagick to directly calculate the SSIM of two images and find the point where “file size is minimized without falling below the perceptual threshold of 0.85.” I have written a separate in-depth explanation of this yardstick, focusing specifically on SSIM.
Try It Yourself: Slider, SSIM, Optimal Quality
The little tool below runs entirely in your browser — images are never uploaded. Pick an image (or click “Try the sample image”), drag the slider and watch the compressed size and SSIM change; you can also let it automatically find the setting with the smallest size at SSIM ≥ 0.85. The SSIM score is computed in real time on the image you just compressed — exactly the yardstick from the previous section.
Note: browsers’ native JPEG encoders don’t expose chroma subsampling or quantization tables, so this tool shows the slider’s real effect and quantifies the difference with SSIM rather than letting you change encoder internals — which confirms exactly what this article says: quality 100 is not lossless, and the same number means different things across software.
Frequently Asked Questions
Is It Better to Set JPEG Quality to 80 or 100?
Most of the time, a quality of around 80 is sufficient, and 100 should not be the default. A file with quality 85 is 60%–75% smaller than one with quality 100, but the naked eye cannot see any difference. For photos, it is safe to use 85–92; for web pages and social media, 75–82 is sufficient. Quality below 60 produces obvious artifacts.
Is JPEG Quality 100 Lossless?
No. Even when set to 100, JPEG typically discards about 75% of color detail through chroma subsampling, followed by quantization and rounding, resulting in irreversible loss. For lossless compression, use PNG, TIFF, or lossless WebP.
Why Can’t I Find Quality 85 in Photoshop?
Photoshop’s JPEG quality scale ranges from 0 to 12, not from 1 to 100. Its 10 is roughly equivalent to 90 in the reference implementation libjpeg. Different software maps the same number differently, so don’t directly copy numbers across software. Instead, refer to the actual output size and image quality.
How Can I Tell Whether Image Quality Has Noticeably Deteriorated After Compression?
Zooming in and comparing with the original image is the most direct way. If you need an objective metric, use SSIM. JPEGs with quality 85 generally have an SSIM above 0.97, making them visually indistinguishable from the original; around 40, SSIM drops to 0.82–0.87, and artifacts become visible to the naked eye. ImageMagick’s compare command can calculate this score directly.
In Conclusion
The number on the slider is a divisor parameter, not a percentage of image quality; 100 is not lossless, and anything below 60 is a cliff. There is really a simple rule: save photos at 85, save for the web at 80, and don’t bother with 100 — the file size doubles, but image quality does not improve at all.
If you want to learn everything from choosing a format and resizing to adjusting quality and improving webpage speed, check out the complete guide to image compression. The entire process is covered in that article.